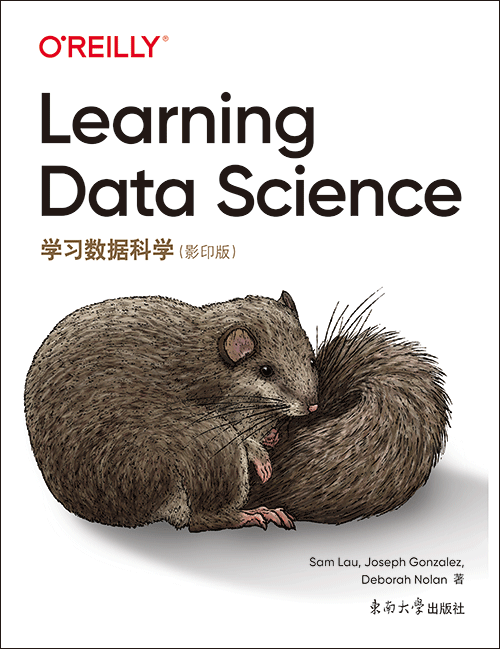
数据科学入门(影印版)
出版时间:2024年03月
页数:594
“我真希望在第一次用‘数据科学家’这个词来描述我们的工作时能有这本书。如果你想从事数据科学/工程、AI或机器学习,这本书就是你的起点。”
——DJ Patil博士
美国第一位首席数据科学家
作为一名有抱负的数据科学家,你理解为什么组织机构的重要决策都依赖于数据 —— 无论是设计网站的公司、决定如何改善服务的城市,还是致力于阻止疾病传播的科学家。你需要具备将一堆杂乱的数据提炼成可操作的洞见所需的技能。我们称之为数据科学生命周期:收集、整理、分析数据并从中得出结论的过程。
本书是第一本兼顾编程和统计学基础技能的书籍,涵盖了整个数据科学生命周期。它面向那些希望成为数据科学家或与数据科学家合作的读者,以及希望跨越“技术/非技术”界限的数据分析师。如果具备基本的Python编程知识,你将学到如何使用像pandas这样的行业标准工具来处理数据。
● 将感兴趣的问题提炼为可通过数据研究的问题
● 进行数据收集可能涉及的文本处理、Web抓取等技术
● 通过数据清洗、探索和可视化获得有价值的洞见
● 学习如何使用建模来描述数据
● 将研究结果推广到数据之外
- Preface
- Part I. The Data Science Lifecycle
- 1. The Data Science Lifecycle
- The Stages of the Lifecycle
- Examples of the Lifecycle
- Summary
- 2. Questions and Data Scope
- Big Data and New Opportunities
- Target Population, Access Frame, and Sample
- Instruments and Protocols
- Measuring Natural Phenomena
- Accuracy
- Summary
- 3. Simulation and Data Design
- The Urn Model
- Example: Simulating Election Poll Bias and Variance
- Example: Simulating a Randomized Trial for a Vaccine
- Example: Measuring Air Quality
- Summary
- 4. Modeling with Summary Statistics
- The Constant Model
- Minimizing Loss
- Summary
- 5. Case Study: Why Is My Bus Always Late?
- Question and Scope
- Data Wrangling
- Exploring Bus Times
- Modeling Wait Times
- Summary
- Part II. Rectangular Data
- 6. Working with Dataframes Using pandas
- Subsetting
- Aggregating
- Joining
- Transforming
- How Are Dataframes Different from Other Data Representations?
- Summary
- 7. Working with Relations Using SQL
- Subsetting
- Aggregating
- Joining
- Transforming and Common Table Expressions
- Summary
- Part III. Understanding The Data
- 8. Wrangling Files
- Data Source Examples
- File Formats
- File Encoding
- File Size
- The Shell and Command-Line Tools
- Table Shape and Granularity
- Summary
- 9. Wrangling Dataframes
- Example: Wrangling CO2 Measurements from the Mauna Loa Observatory
- Quality Checks
- Missing Values and Records
- Transformations and Timestamps
- Modifying Structure
- Example: Wrangling Restaurant Safety Violations
- Summary
- 10. Exploratory Data Analysis
- Feature Types
- What to Look For in a Distribution
- What to Look For in a Relationship
- Comparisons in Multivariate Settings
- Guidelines for Exploration
- Example: Sale Prices for Houses
- Summary
- 11. Data Visualization
- Choosing Scale to Reveal Structure
- Smoothing and Aggregating Data
- Facilitating Meaningful Comparisons
- Incorporating the Data Design
- Adding Context
- Creating Plots Using plotly
- Other Tools for Visualization
- Summary
- 12. Case Study: How Accurate Are Air Quality Measurements?
- Question, Design, and Scope
- Finding Collocated Sensors
- Wrangling and Cleaning AQS Sensor Data
- Wrangling PurpleAir Sensor Data
- Exploring PurpleAir and AQS Measurements
- Creating a Model to Correct PurpleAir Measurements
- Summary
- Part IV. Other Data Sources
- 13. Working with Text
- Examples of Text and Tasks
- String Manipulation
- Regular Expressions
- Text Analysis
- Summary
- 14. Data Exchange
- NetCDF Data
- JSON Data
- HTTP
- REST
- XML, HTML, and XPath
- Summary
- Part V. Linear Modeling
- 15. Linear Models
- Simple Linear Model
- Example: A Simple Linear Model for Air Quality
- Fitting the Simple Linear Model
- Multiple Linear Model
- Fitting the Multiple Linear Model
- Example: Where Is the Land of Opportunity?
- Feature Engineering for Numeric Measurements
- Feature Engineering for Categorical Measurements
- Summary
- 16. Model Selection
- Overfitting
- Train-Test Split
- Cross-Validation
- Regularization
- Model Bias and Variance
- Summary
- 17. Theory for Inference and Prediction
- Distributions: Population, Empirical, Sampling
- Basics of Hypothesis Testing
- Bootstrapping for Inference
- Basics of Confidence Intervals
- Basics of Prediction Intervals
- Probability for Inference and Prediction
- Summary
- 18. Case Study: How to Weigh a Donkey
- Donkey Study Question and Scope
- Wrangling and Transforming
- Exploring
- Modeling a Donkey’s Weight
- Summary
- Part VI. Classification
- 19. Classification
- Example: Wind-Damaged Trees
- Modeling and Classification
- Modeling Proportions (and Probabilities)
- A Loss Function for the Logistic Model
- From Probabilities to Classification
- Summary
- 20. Numerical Optimization
- Gradient Descent Basics
- Minimizing Huber Loss
- Convex and Differentiable Loss Functions
- Variants of Gradient Descent
- Summary
- 21. Case Study: Detecting Fake News
- Question and Scope
- Obtaining and Wrangling the Data
- Exploring the Data
- Modeling
- Summary
- Additional Material
- Data Sources
- Index
书名:数据科学入门(影印版)
国内出版社:东南大学出版社
出版时间:2024年03月
页数:594
书号:978-1098113001
原版书书名:Learning Data Science
原版书出版商:O'Reilly Media
The animal on the cover of Learning Data Science is an edible dormouse (Glis glis). As you might suspect, these creatures have wound up in human cuisine. The edible dormouse was served grilled as a delicacy in ancient Rome and is still consumed today in Croatia and Slovenia. Edible dormice have squirrel-like bodies with small ears, short legs, large feet, and long, bushy tails. Their front feet have four digits and their hind feet have five. They are predominantly covered in gray to gray-brown fur with white underbellies. Their feet have naked soles that secrete a sticky substance that enables climbing.
These nocturnal creatures spend most of their time in trees. They can be found across Europe and in parts of western and central Asia. While the IUCN categorizes edible dormice as a species of Least Concern, they are threatened by illegal hunting and habitat loss. Many of the animals on O’Reilly covers are endangered; all of them are important to the world. The cover illustration is by Karen Montgomery, based on an antique line engraving from Lydekker’s Royal Natural History.
These nocturnal creatures spend most of their time in trees. They can be found across Europe and in parts of western and central Asia. While the IUCN categorizes edible dormice as a species of Least Concern, they are threatened by illegal hunting and habitat loss. Many of the animals on O’Reilly covers are endangered; all of them are important to the world. The cover illustration is by Karen Montgomery, based on an antique line engraving from Lydekker’s Royal Natural History.
购买选项
